molecules and chromophores, dyes, absorbers, absorption spectrum (macroscopic) and nanoworld...
Basics:
List of molecular graphics:
http://en.wikipedia.org/wiki/List_of_molecular_graphics_systems
http://en.wikipedia.org/wiki/Molecular_graphics
http://en.wikipedia.org/wiki/List_of_web_resources_for_visualizing_molecular_dynamics
http://en.wikipedia.org/wiki/Molecular_design_software
http://en.wikipedia.org/wiki/Molecule_editor
http://en.wikipedia.org/wiki/List_of_software_for_nanostructures_modeling
List of software for molecular mechanics modeling:
http://en.wikipedia.org/wiki/List_of_software_for_molecular_mechanics_modeling
List of quantum chemistry and solid-state physics software:
http://en.wikipedia.org/wiki/List_of_quantum_chemistry_and_solid_state_physics_software
GPU accelerated molecular modelling software:
http://en.wikipedia.org/wiki/Molecular_modeling_on_GPUs
http://www.nvidia.com/object/molecular_dynamics.html
http://dx.doi.org/10.1016/j.jmgm.2010.06.010
Interoperability:
OpenBabel: http://openbabel.sourceforge.net
JOELib — Java version of OpenBabel/OELib
Structure download:
example:
http://www.chemicalbook.com/ChemicalProductProperty_EN_CB2121273.htm
lucifer yellow:
http://pubchem.ncbi.nlm.nih.gov/summary/summary.cgi?cid=12087397
Electron Density Server:
http://eds.bmc.uu.se/eds/
"ex-ample":
deoxyhemoglobin:
http://eds.bmc.uu.se/cgi-bin/eds/uusfs?pdbCode=1a3n
MolviZ.Org: Molecular Visualization Resources with rich collection of molecules:
http://www.umass.edu/microbio/chime/
Hemoglobin:
http://www.umass.edu/molvis/tutorials/hemoglobin/
VERY GOOD
http://biomodel.uah.es/en/water/index.htm
http://www.messiah.edu/departments/chemistry/molscilab/Jmol/collagen/collagen_index.htm
Molecule editor;
Free Standalone programs (multiplatform & MacOSX), just "small programs for dummies":
1/
http://avogadro.openmolecules.net/wiki/Main_Page
2/ MacMolPlt : A modern graphics program for plotting 3-D molecular structures and normal modes (vibrations):
http://www.scl.ameslab.gov/MacMolPlt/
3/Ball view (MACOSX Darwin: auto with CPack (http://www.cmake.org)):
http://en.wikipedia.org/wiki/BALLView
4/ Crystallographic Object-Oriented Toolkit: Coot:
http://lmb.bioch.ox.ac.uk/coot/ near of
Alwyn Jones' O, Quanta, XtalView, CCP4mg
5/CueMol2
aims to visualize the crystallographic models of macromolecules. Currently supported files are molecular coordinates (PDB format), electron density (CCP4, CNS , and BRIX formats), MSMS surface data, and APBS electrostatic potential map. Powered by Mozilla XULRunner, the application framework of Firefox and Thunderbird (and other mozilla-based application as well). http://www.cuemol.org/en/index.php?Download
6/Gabedit (release:October, 2009)
is a Graphical User Interface to GAMESS (US) , GAUSSIAN, MOLCAS, MOLPRO, MPQC, OpenMopac, PC GAMESS, Orca and Q-Chem computational chemistry packages. http://gabedit.sourceforge.net/
7/Molden (dec 2010):
http://www.cmbi.ru.nl/molden/molden.html
8/PyMol:
http://en.wikipedia.org/wiki/PyMOL;
http://pymol.org/
9/RasMol:
http://en.wikipedia.org/wiki/RasMol;
10/SPARTAN (demo):
http://en.wikipedia.org/wiki/Spartan_(software); Molecular mechanics calculations and quantum chemical calculations; spectral properties;
VERY GOOD.
11/VMD
http://en.wikipedia.org/wiki/Visual_Molecular_Dynamics;
http://www.nvidia.com/object/molecular_dynamics.html;
http://www.ks.uiuc.edu/Research/vmd/
12/yasara:
http://www.yasara.org/viewdl/;
http://swift.cmbi.ru.nl/teach/
13/
http://en.wikipedia.org/wiki/WHAT_IF_software; correction of pdb file.
Online editors/viewers with many one-click web services:
2D: in pure Javascript,
http://pubchem.ncbi.nlm.nih.gov/edit/index.html
3D:
http://pubchem.ncbi.nlm.nih.gov/release3d.html
example:
http://pubchem.ncbi.nlm.nih.gov/vw3d/vw3d.cgi?cmd=crtvw&reqid=2150958658207150582
Ref:
http://www.ncbi.nlm.nih.gov/pubmed/21933373 J Cheminform. 2011 Sep 20;3(1):32. PubChem3D: a new resource for scientists.
http://www.ncbi.nlm.nih.gov/Structure/index.shtml
or stand alone
PubChem 3D Viewer :
http://pubchem.ncbi.nlm.nih.gov/pc3d/
Web-based systems are based on 3 strategies
(
http://ex-ample.blogspot.fr/2012/05/web-viewers-molecular-visualization-off.html)
- VRML
- java (JMol needs java machine).
- WebGL : Javascript, HTML5. It doesn't need Java or plugins.
http://en.wikipedia.org/wiki/WebGL
WebGL (Web Graphics Library) is a JavaScript API for rendering interactive 3D graphics within any compatible web browser. WebGL programs consist of control code written in JavaScript and shader code that is executed on a computer's Graphics Processing Unit (GPU). Notable early applications of WebGL include Google Maps and Google Body or Zygote Body. On October 13, 2011 the Google Body site was shut down. Then on January 9, 2012 Zygote Body was launched and core code base (with the Google Cow model as a demo) was made available as an open source project called: http://code.google.com/p/open-3d-viewer/
http://learningwebgl.com/blog/
http://www.webgl.com/
GLmol is a molecular viewer for Web browsers written in WebGL/Javascript. Like Jmol, but MUCH faster, GLmol is a 3D molecular viewer based on WebGL and Javascript.
http://www.webgl.com/2012/03/webgl-demo-glmol-molecular-viewer/
http://webglmol.sourceforge.jp/index-en.html
Surface calculation and visualization (in development; available in special version):
- van der Waals surface
- Molecular surface
- Solvent accessible surface
- Solvent excluded surface
http://webglmol.sourceforge.jp/surface.html
Surface representation is a convenient way to visualize protein-protein and protein-ligand interactions. However, surface calculation of macromolecules is computationally and memory intensive. Furthermore, calculated mesh is very complex, often exceeding 500000 polygons. Therefore its implementation in Javascript/WebGL was considered to be very difficult.
EDTSurf algorithm published by Dong Xu and Yang Zhang in 2009 (EDTSurf: Quick and accurate construction of macromolecular surfaces; D. Xu, Y. Zhang (2009) Generating Triangulated Macromolecular Surfaces by Euclidean Distance Transform. PLoS ONE 4(12): e8140
) is very efficient and runs with practical speed (even after I ported it to Javascript). I integrated it with GLmol, my WebGL-based molecular viewer, and release it here.
Example: Solvent excluded surface of horse deoxyhaemoglobin (PDBID: 2DHB)
Computation time and Memory usage
In modern computers with Intel Core i5/i7 processor, grid size up to 180x180x180 can be calculated in acceptable time (5-10sec). Although Firefox 8 was about 3 times slower than Chrome, with Firefox 9, the difference is getting smaller. Current problem is its memory usage. It uses about 500MB RAM for computation. The original version written in C++ doesn't use so much memory. Now I am working to reduce memory usage in my Javascript version. Basically, if GLmol runs on your PC, this demo should work. For better performance, I recommend Google Chrome with sufficient memory (>1GB for browser). You can try alpha version from the following link. Please note that this is ALPHA version and there remains many issues. WARNING! This program consumes lots of memory (500-700MB). Your browser and computer might GET VERY SLOW and EVEN CRASH if memory is insufficient!
Demo version
To limit CPU & memory usage, calculation grid size is restricted to 180x180x180. Therefore, if you calculate a large surface, output quality will be compromised.
To learn how to embed GLmol into your page, please examine source code of :
http://webglmol.sourceforge.jp/glmol/embedding-examplesEN.html (1)
The following model is horse deoxyhaemoglobin(Adapted from PDB 2DHB).
The Iron atom (colored ocher) is coordinated by five nitrogen atoms (colored blue); four from a heme and one from a histidine residue in the protein. When oxidized, an oxygen molecule binds at the opposite side of the histidine as another axial ligand.
You can embed multiple instances of GLmol in a page. Molecular representations can be customized by Javascript. For the details, please examine the source code of this page (1). If it is not clear, don't hesitate to ask (biochem_fan at users.sourceforge.jp).
http://www.rcsb.org/pdb/explore/explore.do?structureId=2dhb
Three dimensional fourier synthesis of horse deoxyhaemoglobin at 2.8 Angstrom units resolution.Bolton, W., Perutz, M.F., Journal: (1970) Nature 228: 551-552
WebGL Other libraries:
just for the fun:
http://www.chromeexperiments.com/detail/protein-ribbon-models/?f=
http://www.ichemlabs.com
Technology: WebGL, ChemDoodle Web Components, jQuery, glMatrix, XHR2
SpiderGL
Visualization Methods for Molecular Studies on the Web Platform
http://vcg.isti.cnr.it/Publications/2010/CADZS10/
see also:
http://ex-ample.blogspot.fr/2012/05/web-viewers-molecular-visualization-off.html
The ChemDoodle Web Components, which display 3D molecular models and other chemical structures in web pages, have hit version 4.4.0; this new and improvedProtein Data Bank model demo is particularly nice, as is this new demo for crystallography.
Many frameworks:
List of molecular graphics systems with Java applet :
Jmol: Java applet or stand-alone application. It does not require 3D acceleration plugins.
Jmol supports many molecular file formats, including Protein Data Bank (pdb), Crystallographic Information File (cif), MDL Molfile (mol), and Chemical Markup Language (CML).
extension for mediawiki:
http://www.mediawiki.org/wiki/Extension:Jmol. The
tag can be used to display in 3d a molecule file that has been previously uploaded into Wikipedia. Some examples of its usage are available in the Jmol wiki: http://wiki.jmol.org/index.php/MediaWiki/Basic%20Example
MDL Chime is a free plugin used by web browsers (windows) to display the 3D structures of molecules. It is based on the RasMol code. Stable release: 2.6 SP7 / July 31, 2007; 5 years ago. Chime largely has been superseded by Jmol. A feature of Chime which is not yet reproduced with Jmol is the calculation of electrostatic or hydrophobic potential for use in coloring molecular surfaces. Instead, Jmol relies on this data being provided by other calculation packages.
Molekel: stable 5.4 / August 2009; 2 years ago.
36MB Mac OS X Intel (built on Mac OS X 10.4.11; require X11 due to a dependency in one of the libraries). Complete control over the generation of molecular surfaces (bounding box and resolution); Visualization of the following surfaces: orbitals; Isosurface from electron density data; Isosurface from Gaussian cube grid data;Solvent-accessible surface (SAS); Solvent excluded surface (SES); Van del Waals radii; Animation of molecular surfaces; Animation of vibrational modes;Export animation; Plane widget to visualize a scalar field: the plane can be freely moved in 3d space and the points on the plane surface will be colored according to the value of the scalar field: a cursor can be moved on the plane surface to show the exact value of the field at a specific point in space; Fully Doxygen-commented source code. You can also build:
http://molekel.cscs.ch/svn/molekel and
http://molekel.cscs.ch/wiki/pmwiki.php/Main/Build
http://molekel.cscs.ch/wiki/pmwiki.php
Sirius:
http://en.wikipedia.org/wiki/Sirius_visualization_software; Interactive calculation of hydrogen bonding, steric clashes, Ramachandran plots
SRS3D Viewer: http://srs3d.org/
WebMol:
http://www.cmpharm.ucsf.edu/cgi-bin/webmol.pl (very old).
Relibase:
http://www.ccdc.cam.ac.uk/free_services/relibase_free/
Proteopedia:
http://www.proteopedia.org/wiki/index.php/Main_Page; Java applet integrated into web front-end.
Chemistry Development Kit: The CDK was created by Steinbeck, Willighagen and Gezelter, the developers of Jmol and JChemPaint (2D). The CDK itself is a library, instead of a user program. However, it has been integrated into various environments to make its functionality available, the R (programming language),CDK-Taverna (a Taverna workbench plugin), Bioclipse, and Cinfony. Additionally, CDK extensions exist for KNIME and Excel (excel-cdk). Chemoinformatics: substructure search using exact structures and SMARTS-like queries, QSAR descriptor calculation,
Kuhn et al (2010). "CDK-Taverna: an open workflow environment for cheminformatics". BMC Bioinformatics 11: 159. doi:10.1186/1471-2105-11-159.
-
--------------Environment
Extensible Computational Chemistry Environment (ECCE) The Extensible Computational Chemistry Environment provides a sophisticated graphical user interface, scientific visualization tools, and the underlying data management framework enabling scientists to efficiently set up calculations and store, retrieve, and analyze the rapidly growing volumes of data produced by computational chemistry studies.
-importing results from NWChem, GAMESS-UK, AMICA, Gaussian 94, Gaussian 98, and Gaussian 03 calculations
-Remote submission of calculations to UNIX and Linux workstations, Linux clusters, and supercomputers. Supported queue management systems include PBS, LSF, NQE/NQS, LoadLeveler and Maui Scheduler.
--------------
First, "virtual molecules" are only an image. How to visualize virtual molecules-macromolecules-nanostructures?
Physical models and computer models:
MD = Molecular Dynamics; MM = Molecular modelling and molecular orbital visualization; Optical = Optical microscopy; SMI = Small molecule interactions;
Stand-alone systems: around 30 software
Web-based systems: 4-10 systems
The most important representation is the "space-filling" representation
Ref:
http://en.wikipedia.org/wiki/Space-filling_model;
http://en.wikipedia.org/wiki/Molecular_graphics
Units:
http://en.wikipedia.org/wiki/Van_der_Waals_radius
http://en.wikipedia.org/wiki/Van_der_Waals_surface
≠ spherical single atom
For a molecule, volume enclosed by the "van der Waals surface".
The van der Waals volume of a molecule is always smaller than the sum of the van der Waals volumes of the constituent atoms: the atoms can be said to "overlap" when they form chemical bonds.
HOMOGENIZATION
(Ref theory homogenization:
http://www.plosone.org/article/info%3Adoi%2F10.1371%2Fjournal.pone.0014350):
The van der Waals volume of an atom or molecule is determined by experimental measurements on gases
from
- the van der Waals constant b,
- the polarizability α or
- the molar refractivity A
In all 3 cases, measurements are made on macroscopic samples and it is normal to express the results as molar quantities. To find the van der Waals volume of a single atom or molecule, it is necessary to divide by the Avogadro constant N
A.
the van der Waals constant b,
The van der Waals equation of state is the simplest and best-known modification of the ideal gas law :
where n is the amount of substance of the gas in question and a and b are adjustable parameters; a is a correction for intermolecular forces and b corrects for finite atomic or molecular sizes; the value of b equals the volume of one mole of the atoms or molecules.
The van der Waals equation also has a "microscopic interpretation": molecules interact with one another. The interaction is strongly repulsive at very short distance, becomes mildly attractive at intermediate range, and vanishes at long distance.
Thus, a fraction of the total space becomes unavailable to each molecule as it executes random motion. In the equation of state, this volume of exclusion (nb) should be subtracted from the volume of the container (V), thus: (V - nb). The other term a(n/V)^2 that is introduced in the van der Waals equation, describes a weak attractive force among molecules (known as the van der Waals force), which increases when n increases or V decreases and molecules become more crowded together.
For helium (monoatomic gas) b = 23.7 cm3/mol.
-> r
w= 0.211nm
This method may be extended to diatomic gases by approximating the molecule as a rod with rounded ends where the diameter is 2r
w and the internuclear distance is d. The algebra is more complicated, but the relation:
can be solved by the normal methods for cubic functions.
O
2: d=0.1208nm; b=31.83cm3/mol (Values of d and b from Weast (1981))
Therefore the van der Waals volume of a single molecule: V
w=0.05286nm^3;
which corresponds to r
w = 0.206nm.
http://petitjeanmichel.free.fr/itoweb.petitjean.freeware.html
http://petitjeanmichel.free.fr/itoweb.petitjean.spheres.html
The molar refractivity A
The molar refractivity A of a gas is related to its refractive index n by the Lorentz–Lorenz equation:
The refractive index of helium n = 1.000 0350 at 0 °C and 101.325 kPa which corresponds to a molar refractivity A = 5.23×10⁻⁷ m3/mol. Dividing by the Avogadro constant gives V
w= 8.685×10⁻³¹ m3 = 0.0008685 nm3, corresponding to r
w= 0.059nm.
The polarizability
The polarizability α of a gas is related to its electric susceptibility χe by the relation
and the electric susceptibility may be calculated from tabulated values of the relative permittivity εr using the relation χe = εr–1. The electric susceptibility of helium χe = 7×10⁻⁵ at 0 °C and 101.325 kPa, which corresponds to a polarizability α = 2.307×10–41 Cm2/V. The polarizability is related the van der Waals volume by the relation
so the van der Waals volume of helium V
w=2.073×10⁻³¹ m3 = 0.0002073nm3 by this method, corresponding to r
w=0.037nm.
The term "atomic polarizability" is preferred as polarizability is a precisely defined (and measurable) physical quantity, whereas
"van der Waals volume" can have any number of definitions depending on the method of measurement.
Helium r
w=0.140nm=140pm
http://periodictable.com/Properties/A/VanDerWaalsRadius.v.html
http://www.webelements.com/periodicity/van_der_waals_radius/
For example, the van der Waals volumes and surfaces of amino acids are given in The Amino Acid Repository:
http://www.imb-jena.de/IMAGE_AA.html
At the other extreme scale (nanometre/picometre; "microscopic theory"), the Lennard-Jones potential (also referred to 12-6 potential) is a model that "approximates" the interaction between a pair of atoms (neutral) or molecules [Lennard-Jones,1924; http://dx.doi.org/10.1098%2Frspa.1924.0082].
Ex-ample: Argon r0=0.335nm and E0 =0.01eV , the Lennard-Jones potential is a potential energy:
r=r
0 @ E
p=
0.
"rm"
1/r^12 = approximation of The Pauli exclusion principle (no 2 identical fermions (particles with half-integer spin) may occupy the same quantum state simultaneously; a more rigorous statement is that the total wave function for two identical fermions is anti-symmetric with respect to exchange of the particles;
http://en.wikipedia.org/wiki/Pauli_exclusion_principle).
1/r^6 = approximation of The van der Waals force (or van der Waals interaction)
The van der Waals force is the sum of the attractive or repulsive forces between molecules (or between parts of the same molecule) other than those due to covalent bonds or to the electrostatic interaction of ions with one another or with neutral molecules.
It includes 3 forces (
http://en.wikipedia.org/wiki/Van_der_Waals_force):
-force between two permanent dipoles (Keesom force)
-force between a permanent dipole and a corresponding induced dipole (Debye force)
-force between two instantaneously induced dipoles (London dispersion force)
where
ε is the "depth of the potential well", σ is the finite distance at which the inter-particle potential is zero, r is the distance between the particles, and is the distance at which the potential reaches its minimum. At r
m, the potential function has the value −ε. The distances are related as r
m=2^(1/6)σ~1.225σ.
Whereas the functional form of the attractive term has a clear physical justification, the repulsive term has no theoretical justification. It is used because it approximates the Pauli repulsion well, and is more convenient due to the relative computational efficiency of calculating r^12 as the square of r^6 [
http://en.wikipedia.org/wiki/Lennard-Jones_potential].
The L-J potential is particularly accurate for noble gas atoms (helium (He), neon (Ne), argon (Ar), krypton (Kr), xenon (Xe), and radon (Rn)) and is a good approximation at long and short distances for neutral atoms and molecules.
The Stockmayer potential [Stockmayer W. H. J. Chem. Phys., 1941] or the 12-6-3 potential (a mathematical model for representing the interactions between pairs of atoms or molecules) consists of the Lennard-Jones potential with an embedded point dipole
[http://en.wikipedia.org/wiki/Stockmayer_potential], [
wikipedia-russian], [
http://www.owlnet.rice.edu/~mjweeks/CHBE401_Project/Len-Jones/Len-Jones1.html], [
googleBooks-H20-NH3], [
liquid water: http://www.tandfonline.com/doi/abs/10.1080/002689797169916; http://pubs.acs.org/doi/abs/10.1021/ba-1983-0204.ch013]:
Assuming that the molecules interact as alined dipoles of maximum attraction, values for sigma, epsilon, and delta were determined for various polar molecules by a least squares fit of experimental viscosity data. Satisfactory results were obtained for slightly polar molecules, but not for more highly polar molecules (polar gases) such as NH3 or H2O [
http://archive.org/details/nasa_techdoc_19980237089].
The Stockmayer term takes into account the increased repulsion between dipoles of similar orientation:
When the orientation of the dipole is switched to opposite orientation, the plot shows the added attraction between the molecules.
Rem: the main quantity is = a potential well is the region surrounding a local minimum of potential energy. Energy captured in a potential well is "unable" to convert to another type of energy.
Bridge from macroscopic to microscopic physics: the Boltzmann constant, k (entropy), is a bridge between macroscopic and microscopic physics, since temperature (T) makes sense only in the macroscopic world, while the quantity kT gives a quantity of energy which is on the order of the average energy of a given atom in a substance with a temperature T. k=8.617×10⁻⁵ eV/K then
0.013eV, at room temperature.
In the case of bulk liquid water at room temperature, there are many models and many data:
http://en.wikipedia.org/wiki/Water_model; http://en.wikipedia.org/wiki/Electromagnetic_absorption_by_water; http://en.wikipedia.org/wiki/Self-ionization_of_water; http://en.wikipedia.org/wiki/Water_(properties); http://omlc.ogi.edu/spectra/water/
The molecules of H
20 are constantly moving in relation to each other, and the hydrogen bonds (highly directional hydrogen-bond network structure) are continually breaking and reforming at timescales faster than 250 femtoseconds [
http://www.pnas.org/content/102/40/14171].

A water molecule can form a maximum of 4 hydrogen bonds because it can accept 2 and donate 2 hydrogen atoms. Other molecules (hydrogen fluoride, ammonia, methanol) form hydrogen bonds but they do not show anomalous behavior of thermodynamic, kinetic or structural properties like those observed in water. The answer to the apparent difference between water and other hydrogen bonding liquids lies in the fact that apart from water none of the hydrogen bonding molecules can form 4 hydrogen bonds, either due to an inability to donate/accept hydrogens or due to steric effects in bulky residues. In water, local tetrahedral order due to the 4 hydrogen bonds gives rise to an open structure and a 3-dimensional bonding network, resulting in the anomalous decrease of density when cooled below 4 °C.
Although hydrogen bonding is a relatively weak attraction compared to the covalent bonds within the water molecule itself, it is responsible for a number of water's physical properties. One such property is its relatively high melting and boiling point temperatures; more energy is required to break the hydrogen bonds between molecules. The extra bonding between water molecules also gives liquid water a large specific heat capacity. This high heat capacity makes water a good heat storage medium (coolant) and heat shield.
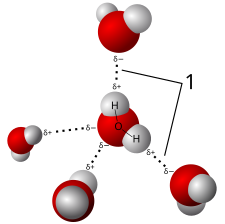

5-site model and 3-site model (Flexible SPC water)
In molecular dynamics simulations the flexible simple point charge water model (or Flexible SPC water; a re-parametrization of the 3-site SPC water model) gives the correct density and dielectric permittivity of water [
Praprotnik,2004;http://www.sicmm.org/~praprot/publications/jp046158d.pdf]. Flexible SPC is implemented in the MDynaMix, Abalone programs... The SPC model assumes an ideal tetrahedral shape (HOH angle of 109.47°) instead of the observed angle of 104.5°.
----------------
Remark: Atomic units (a.u.) form a system of natural units which is especially convenient for nm or pm calculations. There are 2 different kinds of atomic units, which one might name Hartree atomic units and Rydberg atomic units, which differ in the choice of the unit of mass and charge.
Some particle has a mass m which is 2.4 times the mass of electron---2.4 a.u.
http://en.wikipedia.org/wiki/Atomic_units
-----------------
electron density and cloud
The Electron Localization Function ELF η(r) for a chemical system is a scalar field in 3D space.
http://www.cpfs.mpg.de/ELF/index.php?content=05graph.txt
Concerning the interpretation of the absolute values of ELF in the original paper [BECKE1990] the following hint was given: "... the upper limit ELF = 1 corresponding to perfect localization and the value ELF=½ corresponding to electron-gas-like pair probability". Two remarks can be made:
1.) Concerning the upper limit it may be justified that the authors interpret this value "corresponding to perfect localization" as they have given before their definition of "localization". However, in order to avoid confusion, e.g. with the much older physical concept of localized and itinerant electrons used in modern solid state electronic structure theory, the analysis of ELF should usually be performed in terms "high/low values of η" instead of "high/low electron localization". A simple example may serve as a demonstration: a single-determinant (Hartree-Fock or Kohn-Sham) solution for a H2 molecule gives one doubly occupied &sigma bonding orbital. The &eta(r) distribution is equal to 1.0 everywhere in space. Thus, in the sense of the above definition, each electron is "perfectly localized" at every point in space. Concluding this remark there certainly is a relation (to be found in the future) between the physical concept of localized and itinerant electrons and ELF but it seems to be a subtle one and the terms should not be intermixed.
2.) For the value η = ½ the authors give the absolutly correct interpretation. Any further interpretation of the &eta = ½ and lower values has to be justified strictly. Clearly, points or regions with &eta(r) = 0.5 for a chemical system do not imply "perfectly delocalized electrons".
For many years the size of atoms/molecules has been approximated by physical models in which the volumes of plastic balls describe where much of the electron density is to be found often sized to van der Waals radii. That is, the surface of these models is meant to represent a specific level of density of the electron cloud.
It is now relatively common to see images of surfaces that have been colored to show quantities such as electrostatic potential. Common surfaces in molecular visualization include solvent-accessible ("Lee-Richards") surfaces, solvent-excluded ("Connolly") surfaces, and isosurfaces. Opaque isosurfaces do not allow the atoms to be seen and identified and it is not easy to deduce them. Because of this, isosurfaces are often drawn with a degree of transparency.
In the last decade almost all of this technology has become commoditized. In 1992, Roger Sayle released his
RasMol program into the public domain. MG continues to see innovation that balances technology and art, and currently zero-cost or open source programs such as
PyMOL and
Jmol have very wide use and acceptance. Recently the wide spread diffusion of advanced graphics hardware, has improved the rendering capabilities of the visualization tools. The capabilities of current shading languages allow the inclusion of advanced graphic effects (like ambient occlusion, cast shadows and non-photorealistic rendering techniques) in the interactive visualization of molecules. These graphic effects, beside being eye candy, can improve the comprehension of the three dimensional shapes of the molecules. An example of the effects that can be achieved exploiting recent graphics hardware can be seen in the simple open source visualization system
QuteMol.
http://www.pymolwiki.org/index.php/MAC_Install
Forster-distance-calculator: Can be used as a pymol-python shortcut to calculate the Förster distance between dyes from different companies. Useful, if the user have pymol installed, but not python. This script is meant as a tool to finding the right dyes, when labelling suitable positions for the site-directed cysteine mutants.
Nowadays fitting of the molecular structure to the electron density map is largely automated by algorithms with computer graphics a guide to the process. An example is the
XtalView XFit program (~100000 lines of C and Fortran).
http://www.duncanmcree.com/xtalview.html
----------
example:
http://demonstrations.wolfram.com/VanDerWaalsSurface/
---------------web services:
visualizing molecular dynamics (from pdb file)
Molecules are "bouillaunantes" (@ T much greater than 0°K)
-tinker:
http://dasher.wustl.edu/tinker/downloads/bin-macosx-6.0.11.tar.gz
-motions that occur in proteins and other macromolecules:
http://molmovdb.org/
-with Flexible SPC water model: PC &linux: http://sourceforge.net/projects/ascalaphgraphic/
-
http://wishart.biology.ualberta.ca/moviemaker/
-This site provides tools for online normal mode calculation, even for large proteins and including all atoms, and algorithms that use normal modes for structural refinement or optimization:
http://lorentz.immstr.pasteur.fr/nomad-ref.php
---------------
For nano:
NanoEngineer-1 and QuteMol (viewer with many "realistics"):
-------------------------------------------
Electronic absorption spectra (one or multiphoton) and solvents
Which software can I use to calculate the effects of solvents on the electronic absorption spectra properties of molecules?
I mean spectra properties like transition energies, oscillator strength, transition moments and polarizabilities etc...
Gaussian 09 using the keyword: Solvent=(). In the users book you will find which solvents are available for calculating.
NWChem (
http://www.nwchem-sw.org/index.php/Download). It is open source (100MB) and these types of calculations can be done either with continuum models or QM/MM. This is a tricky business. The continuum solvation model won't work if hydrogen bonds play a role in your case. Alternatively, you can represent the solvent explicitly. This needs a molecular simulation and afterwards you will average your result over several snapshots of your solute/solvent system. The latter computations would be done in a QM/MM fashion.
You see, it's getting hairy. But there has been some recent progress in this. Yet, the method - called polarizable embedding (PE) - is still in a developer's state. It is implemented in DALTON (for DFT and coupled cluster). Contact the authors of that method for a collaborative investigation.
Excited States in Solution through Polarizable Embedding; J. Chem. Theory Comput., 2010, 6 (12), pp 3721–3734; DOI: 10.1021/ct1003803:
http://pubs.acs.org/doi/abs/10.1021/ct1003803
See also: Advances in Quantum Chemistry, Volume 61,
chap 3, (40pages) 2011.
THE JOURNAL OF CHEMICAL PHYSICS 134, 104108 (2011),
The polarizable embedding coupled cluster PE-CC method, Kristian Sneskov,Tobias Schwabe,Jacob Kongsted,Ove Christiansen:
http://144.206.159.178/FT/18538/933480/16286981.pdf
GPU and NWchem:
http://www.nvidia.com/object/molecular_dynamics.html
The calculation of excitation energies, one- and two-photon absorption properties, polarizabilities and
hyperpolarizabilities all coupled to a polarizable MM environment. Previously, one of us reported the
polarizable embedding density functional theory (PE-DFT) approach describing in the process the polarizable embedding Hartree–Fock (PE-HF) method. This is essential for this work since the reference orbitals are those from a PE-HF calculation.
They investigated the absorption spectrum of aqueous N-methyl acetamide (NMA; important building block of all proteins) with a specific focus on polarization effects. The formamide and NMA systems each consists of 120 conformations generated in a calibrated MD simulation containing roughly 250 water molecules. Previously, this has been shown to be sufficient to incorporate the bulk properties of water. All Photoactive yellow protein (PYP) calculations are based on the x-ray structure of PYP (PDB accession code 1nwz) with a reported accuracy of 0.82 Å.
The PE-CC strategy and calculations described in this paper have been implemented and carried out in a local version of the DALTON quantum chemistry program.
Dalton is an ab initio quantum chemistry software program, capable of calculating various molecular properties using the Hartree–Fock, MP2, MCSCF and coupled cluster theories. Version 2.0 of DALTON added support for density functional theory DFT calculations. DALTON by the Centre for Theoretical and Computational Chemistry. CTCC was founded by the Norwegian Research Council in 2007 and the duration of the project is 10 years. One main focus is on method development in electronic structure theory.
http://dirac.chem.sdu.dk/daltonprogram.org
http://chem.au.dk/en/
---basics with mathematica:
http://demonstrations.wolfram.com/HydrogenOrbitals/
http://demonstrations.wolfram.com/TimeEvolutionOfAWavepacketInASquareWell/
http://demonstrations.wolfram.com/QuantumWellExplorer/
http://demonstrations.wolfram.com/BondingAndAntibondingMolecularOrbitals/
-------------------------
Nanostructures modeling at classical and quantum levels.
polymers, nanotubes, proteins, nucleic acids, quantum dots..., nanophotonics, nanofluidics...
a list of free computer programs:
http://en.wikipedia.org/wiki/Ascalaph_Designer (Flexible SPC water model, Implicit water model; Quantum chemistry with aid of CP2K and PC GAMESS/Firefly; Linux and XP)
http://en.wikipedia.org/wiki/CoNTub (CoNTub v2.0 (Released May-13-2011))
http://www.nanoengineer-1.com/content/
http://www.jcrystal.com/ (demo version; Nanotube Modeler is a program for generating xyz-coordinates of nano geometries (Nanotubes, Nanocones, Graphene sheets, Nano-holes, Viruses).JCrystal is a computer program for creating, editing, displaying and deploying crystal shapes. It also includes the JCrystalApplet for exporting interactive webpages.)
http://turin.nss.udel.edu/research/tubegenonline.html (Web-Accessible Nanotube Structure Generator and TubeGen utility (stand alone))
http://en.wikipedia.org/wiki/Nanohub
nanoHUB.org is a science and engineering gateway
https://nanohub.org/resources/tools
https://nanohub.org/tools/qdot
For nanoparticules Silver, Gold, Nickel-Silver (surface plasmon resonance band)
A theoretical study of structural, electronic and optical properties of complexes, clusters and nanostructures:
https://sites.google.com/site/franckrabilloud/Home/research-interests
http://iopscience.iop.org/0953-4075/44/3/035101
Optical response of silver nanoclusters complexed with aromatic thiol molecules: a time-dependent density functional study; M Harb et al 2011 J. Phys. B: At. Mol. Opt. Phys. 44 035101 doi:10.1088/0953-4075/44/3/035101
----------------------------------------
Molecular Modeling Basics
---> from Jan H. Jensen
A big part of the motivation for my blog came from writing a book called Molecular Modeling Basics that was published in May, 2010 by CRC Press (http://www.crcpress.com/product/isbn/9781420075267). While writing the applications sections it was frustrating to turn the beautifully colored figures into black-and-white versions in order to keep the cost of the book reasonable.
Molecular Modeling in Chemical Education.
He creates Jmol applications for educational use, like this one, which animates rotational and vibrational energy states in water:
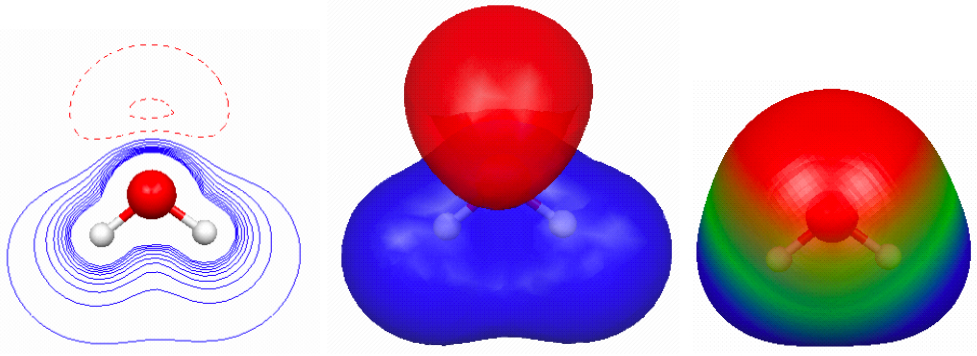
for water : Electrostatic potential maps
http://propka.ki.ku.dk/~luca/wiki/index.php/JansPage
http://molecularmodelingbasics.blogspot.fr/
http://molecularmodelingbasics.blogspot.fr/2012/04/virtual-molecular-modeling-kit.html
http://molecularmodelingbasics.blogspot.fr/search/label/transition%20metals
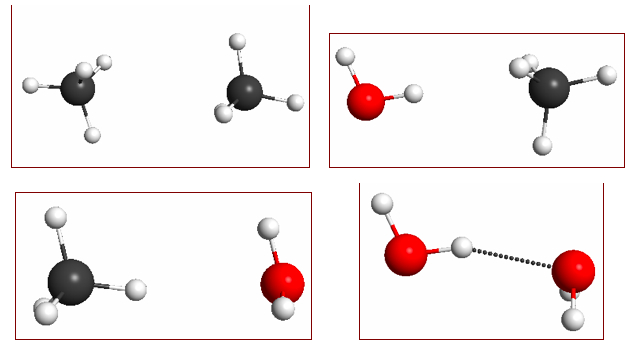
the strengths of interaction between methane, methane-water, and water dimer is due to their differences in polarity, which can be visualized using molecular electrostatic potentials (MEPs):
http://molecularmodelingbasics.blogspot.fr/2010/04/polarization-and-intermolecular.html
with interactive Jmol versions with java: http://propka.ki.ku.dk/~jhjensen/fig4-16.html
http://propka.ki.ku.dk/~jhjensen/fig4-14.html
When molecules (CH4 and H20) attract:
The molecular dimers shown in Figure 4.14 have very different interaction energies: -0.5, -1.0, -0.6, and -5.1 kcal/mol, respectively; which are reasonably well reproduced at the M06/6-31+G(2d,p)// M06/6-31G(d) level of theory: -0.4, -0.5, 0.0, and -4.9 kcal/mol.
The source of this difference in intermolecular attraction can be easily visualized with electrostatic potential maps (Figure 4.15). Methane is non-polar and the main source of attraction in the methane dimer is dispersive forces (which are hard to visualize). Water is polar, and the methane–water interaction (where the water is the H-donor) is a bit stronger than the methane dimer. This is due to an electrostatic interaction - more specifically polarization, but more about this in a future post.
0.002 au isodensity surface with superimposed molecular electrostatic potential for (a) methane dimer, (b) water–methane dimer where water acts as an H-bond donor, (c) water–methane dimer where methane acts as an H-bond donor, and (d) water dimer. The maximum potential value is 0.05 au and the level of theory is M06/6-31+G(2d,p)//M06/6-31G(d).
http://propka.ki.ku.dk/~jhjensen/fig4-15.html
Instructions on how to make interactive electrostatic potential maps with Jmol can be found here. Finally, I introduce a new feature (pop-up windows) to the blog because I can't figure out how to include Jmol buttons (which gives more control to the viewer) into blog posts. This feature also gives you access to the underlying GAMESS files as I have discussed here.
ions
http://molecularmodelingbasics.blogspot.fr/2010/02/im-positive.html
0.002 au isodensity surface with superimposed electrostatic potential of (a) Li+, (b) Na+, and (c) K+ ion. The maximum potential value is 0.8 au, and the level of theory is B3LYP/6-31G(d).
Why does the ionization energy decrease on from Li to Na to K? That's the same as asking why the electron affinities decrease on going from Li+ to Na+ to K+.
This Figure shows the ions colored by how positive they are at the surface (i.e. the electrostatic potential superimposed on the 0.002 isodensity surface). The darker the
color the more positive the ion, and it is clear that the Li+ ion is “more positive” than Na+, which is more positive than K+. Thus, more energy should be released when adding an electron to Li+ compared to Na+, and hence more energy is needed to remove an electron from Li
compared to Na (and similarly for K).
The reason why Li+ is “more positive” than Na+ or, more accurately, why the potential on the 0.002 au isodensity surface is more positive for Li+ than for Na+, is that the former is a smaller ion than the latter, so the surface is closer to the +1 charge at the center of the ion.
When making these figures it is very important to get the relative sizes of the ions correct, but this can be difficult since each image can be zoomed to an arbitrary size. He shows how to control this in MacMolPlt using the Manual Windows Parameter window.
"Ex-amples" with HF and "monopole, dipole, quadrupole":
Contour plot of the RHF/6-31G(d) electrostatic potential and 0.002 au isodensity surface of (a) CH3COO-, (b) HF, and (c) F2. The maximum/minimum contour values are, respectively, 0.5/0.025; 0.1/0.005; and 0.005/0.00025 au respectively. Blue corresponds to a negative potential. In each case the outer-most contour looks like the corresponding contour in the electrostatic potential due to a charge, dipole, and quadrupole, respectively.
----------------
TIPS:
Rotating molecules in PowerPoint
http://molecularmodelingbasics.blogspot.fr/2010/05/rotating-molecules-in-powerpoint.html
2 ways of doing this that are relatively easy.
One is to create an animated gif file using the Polyview3D web server, and inserting the file as a movie in Powerpoint.
http://polyview.cchmc.org/polyview3d.html With polyview3D many choices (pymol or rasmol)
Another option is to set the molecule spinning in, for example, Avogadro and then simply record part of the screen using a screencasting program (for example Screencast-o-matic is free, and can make mp4 files, which can be included in Powerpoint).